Days of inventory remaining, per SKU
Days of inventory remaining is how long your current stock lasts at your recent rate of sale, expressed in days rather than units. Restoc is built to show that number per active SKU on one Shopify dashboard, next to current stock and reorder status.
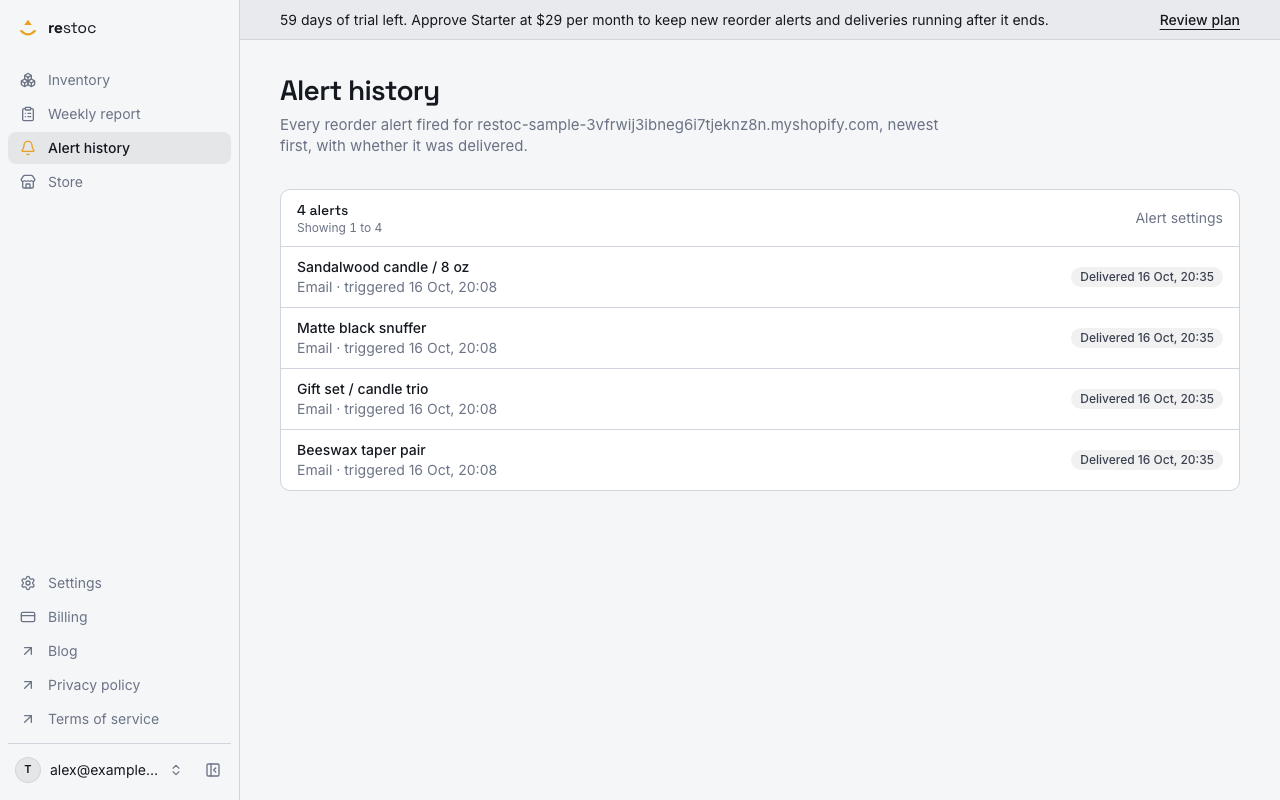
A screenshot of Restoc, which is not open yet, showing sample data. Nothing in it is a promise: what the product does is what this page says in words.
Forty-two units is not an answer
Your stock screen says 42. True, and on its own almost useless.
Forty-two units of a slow SKU that moves one a week is nine months of cover. Forty-two units of your hero SKU in a good month might be nine days, and your supplier takes three weeks to land a box. Same number, two completely different Mondays.
The trouble is that a unit count does not change shape when demand does. A SKU can sit at a comfortable-looking number all quarter, then empty out in under a fortnight because a creator mentioned it or a bundle took off. Nothing on the screen looks different until the number is zero, and by then the decision you needed to make was three weeks ago.
The usual workaround is a spreadsheet. Export the inventory, paste last month's sales, divide, colour the bad rows red, repeat on Sunday night. It works right up until the week you are too busy to do it, which tends to be the week that matters.
Days of inventory remaining closes the gap differently. It converts stock into time, and time is the unit your supplier already works in. Lead time is quoted in days. Cover should be read in days too. Then the comparison is a subtraction you can do in your head: eleven days of stock against a twenty-one day lead time means you are already late.
How Restoc works out the number
- Connect the store
Restoc installs through Shopify's OAuth flow and pulls your live inventory levels and sales history through webhooks plus a scheduled sync job. It is a web app, so there is no mobile app and no browser extension to install.
- Choose the window the pace is measured over
Sales velocity is calculated over a store-wide window you set: 7, 14 or 30 days. Seven reacts fast and moves a lot. Thirty is steadier and slower to notice a spike. On Pro you can override that window for an individual SKU. You also enter supplier lead time per SKU, which is the number days remaining gets compared against.
- Read one row per active SKU
The dashboard lists every active SKU with its current stock, its days of inventory remaining, and its reorder status. Three columns, one scan. Nothing else competing for your attention.
- Start with the SKUs closest to empty
The list defaults to soonest-to-stockout first, and you can sort it by days of inventory remaining or by reorder status. With a few hundred rows that matters: the urgent items are at the top rather than somewhere down the page.
- Know what an empty screen means
While a sync or report is running you get loading skeletons rather than a blank page, and when there is genuinely nothing to show, Restoc says which nothing it is: no SKUs synced yet, or every SKU healthy. The empty state names the next action instead of leaving you guessing.
What each column is for
| Column | What it reads | The decision it drives |
|---|---|---|
| Current stock | Units on hand for that active SKU | Whether you can fulfil what is in the basket today |
| Days of inventory remaining | How long that stock lasts at the pace of your chosen velocity window | Whether the runway is longer than the supplier lead time |
| Reorder status | Whether the SKU sits above or below its reorder point | Whether this SKU goes on the purchase order this week |
Why days, not units
It is already in your supplier's units
Lead times come to you in days and weeks. Cover read in days lines up with them directly, so you stop doing mental arithmetic on the phone to a factory.
Every active SKU on one screen
Not a box you have to know what to type into. The dashboard covers your active SKUs, so the one you were not thinking about is on the list too.
The urgent rows come first
Default order is soonest to stockout, and the table sorts by days remaining or reorder status, so the first screenful is the part of the catalogue that needs a decision.
The pace window is yours to set
A 7 day window catches a spike quickly. A 30 day window ignores a quiet fortnight. You pick which error you would rather make across the store, and on Pro you can override the window for a single SKU.
Stock and status sit next to the runway
Days remaining tells you how long. Reorder status tells you whether the reorder point, built from that velocity and your lead time, has already been crossed. Read together on one row, they answer the question rather than raise another one.
What this screen does not do
We would rather you knew now.
- It reports pace, it does not forecast. Days remaining is your recent sales rate carried forward. It does not model Black Friday, a seasonal curve or a planned promotion. If you are buying for a peak, the number is an input to your judgement, not a replacement for it.
- One location per plan. Every current plan tracks a single location. If you split stock across warehouses, this is not yet the tool for that.
- Web app only. No mobile app, no browser extension.
- A SKU with no sales in the window has no pace. Without a rate of sale there is no meaningful day count to display for it.
Restoc is not open yet. We are building it for Shopify merchants with roughly 50 to 2,000 SKUs who want to know when to reorder without buying a forecasting suite. Join the waitlist and we will tell you when the install flow is live, not before.
What it will cost
Starter, $29 per month
Up to 200 tracked SKUs, one location, with a 60 day free trial. Includes the dashboard showing days of inventory remaining per SKU, reorder points from your sales velocity and lead time, a store-wide velocity window of 7, 14 or 30 days, email and Slack alerts, and the weekly reorder report with suggested order quantities, exportable as CSV. Billed by Shopify on your Shopify invoice, not by a separate card payment. $290 per year if you pay yearly, which is ten months' price for twelve.
Growth, $59 per month
Everything in Starter, up to 1,000 tracked SKUs, one location, 60 day free trial. $590 per year billed yearly, two months free against paying monthly.
Pro, $99 per month
Everything in Growth, up to 2,000 tracked SKUs, one location, plus custom reorder rules: a per-SKU sales velocity window override. 60 day free trial. $990 per year billed yearly.
How the trial is meant to work
The trial runs 60 days, and it is built so at least one full weekly reorder cycle completes before the first charge. The reason is plain: a dashboard of days remaining and a weekly report are only worth judging once a cycle has actually run on your own catalogue, not on day one. Annual billing is surfaced as an option at signup, so you can choose monthly or yearly before anything is charged.
If you want the reasoning behind the number itself, the reorder point page covers how velocity and lead time combine. If you want the version that comes to you rather than waiting on screen, the alerts page covers that.
Questions
What does days of inventory remaining actually mean?
It is your current stock divided by your recent daily rate of sale for that SKU, expressed as a number of days. Twelve days of inventory remaining means that at the pace of the last 7, 14 or 30 days, whichever window you chose, the shelf empties in about twelve days.
Which sales window does the number use?
One you choose: 7, 14 or 30 days, set across the store. A short window reacts quickly to a spike and swings more. A long window is steadier and slower to notice a change. On Pro you can also override the window for an individual SKU.
What happens to SKUs that have not sold recently?
A SKU with no sales inside the velocity window has no rate of sale, so there is no meaningful day count to report for it. Slow movers are better judged on their reorder status and lead time than on a runway figure.
How do I find the SKUs closest to running out?
The dashboard sorts soonest to stockout by default, and you can sort by days of inventory remaining or reorder status. On a few hundred rows that puts the decisions at the top of the page instead of somewhere in the middle.
Do I get told when a SKU is running down, or do I have to check the dashboard?
Restoc is built to send an alert by email or Slack webhook when a SKU crosses its reorder point, so the dashboard is where you go to look, not the thing you have to remember to look at.
Can I see this on my phone?
Restoc is a web app. There is no mobile app and no browser extension, so you open it in a browser like any other tab.
How many SKUs can I track, and what does it cost?
200 on Starter at $29 a month, 1,000 on Growth at $59 a month, and 2,000 on Pro at $99 a month. Paid yearly those are $290, $590 and $990, ten months' price for twelve. Each plan covers one location and comes with a 60 day free trial, billed by Shopify on your Shopify invoice.
Can I use it today?
Not yet. Restoc is in build and running a waitlist. We will email when the Shopify install flow is open rather than before, and you can decide then.